Intensity Histogram using C++ and OpenCV: Image Processing
Theory
The histogram of a digital image with gray levels in the range [0, L-1] is a discrete function h(rk) = nk, where rk is the kth gray level and nk is the number of pixels in the image having gray level rk.
For an 8-bit grayscale image there are 256 different possible intensities, and so the histogram will graphically display 256 numbers showing the distribution of pixels among those grayscale values.
Algorithm
1. Assign zero values to all elements of the array hf;
2. For all pixel (x, y) of the image f, increment hf [f(x, y)] by 1.
Source Code
#include<iostream>
#include<opencv2/highgui/highgui.hpp>
#include<opencv2/imgproc/imgproc.hpp>

using namespace std;
using namespace cv;

int main()
{
    Mat image = imread("picture.jpg", CV_LOAD_IMAGE_GRAYSCALE);

    // allcoate memory for no of pixels for each intensity value
    int histogram[256];

    // initialize all intensity values to 0
    for(int i = 0; i < 255; i++)
    {
        histogram[i] = 0;
    }

    // calculate the no of pixels for each intensity values
    for(int y = 0; y < image.rows; y++)
        for(int x = 0; x < image.cols; x++)
            histogram[(int)image.at<uchar>(y,x)]++;

    for(int i = 0; i < 256; i++)
        cout<<histogram[i]<<" ";

    // draw the histograms
    int hist_w = 512; int hist_h = 400;
    int bin_w = cvRound((double) hist_w/256);

    Mat histImage(hist_h, hist_w, CV_8UC1, Scalar(255, 255, 255));

    // find the maximum intensity element from histogram
    int max = histogram[0];
    for(int i = 1; i < 256; i++){
        if(max < histogram[i]){
            max = histogram[i];
        }
    }

    // normalize the histogram between 0 and histImage.rows

    for(int i = 0; i < 255; i++){
        histogram[i] = ((double)histogram[i]/max)*histImage.rows;
    }


    // draw the intensity line for histogram
    for(int i = 0; i < 255; i++)
    {
        line(histImage, Point(bin_w*(i), hist_h),
                              Point(bin_w*(i), hist_h - histogram[i]),
             Scalar(0,0,0), 1, 8, 0);
    }

    // display histogram
    namedWindow("Intensity Histogram", CV_WINDOW_AUTOSIZE);
    imshow("Intensity Histogram", histImage);

    namedWindow("Image", CV_WINDOW_AUTOSIZE);
    imshow("Image", image);
    waitKey();
    return 0;
}
Output
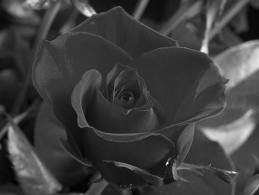
Input Image
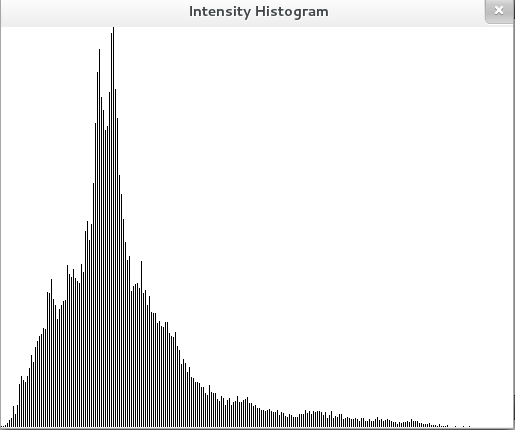
Output Histogram


1>main.cpp(46): warning C4244: '=' : conversion from 'double' to 'int', possible loss of data
histogram[i] = floor(((double)histogram[i]/max)*histImage.rows);
How to plot continuous histogram? Here,this code generates discrete one.
nice code bro
can we add vales of x and y like a graph
can you give me color histogram code